DIVERSITY indices : phylogenetic
06/03/2018
2010 : Vellend
Indices of species’ distinctness
| Index | Description | Type of tree | Reference |
|---|---|---|---|
| Taxonomic distinctness (TD) | Reciprocal of number of nodes between species and root of tree | node-based | 1991 : Vane-Wright |
| To account for polytomies, count number of descendants at each node rather than number of nodes | 1990 : May | ||
| Species originality (SO) | Assign each node in a tree a value of 1 if more species descend from that node than its sister node, and 0 otherwise; sum the values at the nodes between a species and the root; smaller values indicate greater distinctness | node-based | 1992 : Nixon & Wheeler |
| Pendant edge (PE) | Length of the branch connecting a species to the rest of the regional tree | distance-based | 1990 : Altschul & Lipman |
| Species evolutionary history (SEH) | Portion of a phylogenetic tree attributable to a species; shared branches are apportioned equally among descendant lineages | distance-based | 2006 : Redding & Mooers |
| Originality of species within a set (OSS) | Values for each species that ‘maximize the expected dissimilarity between two species randomly drawn from the set’ | distance-based | 2005 : Pavoine |
Type I metrics
- Calculating a distinctness score for all species in a regional phylogeny
- Calculating some function of these scores (typically the sum) for particular subsets of species
Type II metrics
- Starting with a local phylogeny
Aggregation of metrics according to :
- nature of the phylogenetic tree - distance-based metrics - counting nodes metrics (special case of first)
- nature of species data - abundances - presence-absence (special case of first)
| Index | Description presence-absence |
Description abundance-weighted |
Equation |
|---|---|---|---|
| Phylogenetic diversity (PD) | 1992 : Faith Sum of all branch lengths in the portion of a phylogenetic tree connecting the focal set of species |
2002 : Barker For the subset tree, the number of branches multiplied by the weighted mean branch length, with weights equal to the average abundance of species sharing that branch |
|
| Mean phylogenetic distance (MPD) | 2000 : Webb Mean phylogenetic distance between each pair of species in the focal set |
1995 : Warwick & Clarke (1982 : Rao) Mean phylogenetic distance between pairs of individuals, excluding (or not) same-species pairs |
|
| Sum of phylogenetic distances (SPD) | 1997 : Crozier Sum of phylogenetic distances between each pair of species MPD x number of species pairs |
2007 : Helmus Abundance-weighted MPD x number of species pairs |
|
| Mean nearest neighbour distance (MNND) | 2000 : Webb Mean phylogenetic distance from each species to its closest relative in the focal species set |
Weighted mean phylogenetic distance from each species to its closest relative, with weights equal to species’ abundance | |
2013 : Faith
Phylogenetic Diversity (PD) : basis for a measure of biodiversity, that would consider all possible units
(genes, features, species, ecosystems).
Required information about expected relationships among the objects provided by :
- phylogeny
- associated evolutionary models linking phylogenetic pattern to variation at the level of features/units
Link between PD and species richness (SR) ?
- When subsets of different numbers of species are selected randomly from the tree, the average PD value for a given species number has a power curve relationship with the number of species in the subset.
- Departures from the basic power curve depend on the nature of these departures from random sets — whether the species extinctions are clumped or well dispersed on the phylogenetic tree.
PD of a set of species from a phylogenetic tree : minimum total length of all the phylogenetic branches required to connect all those species on the tree.
Loss or gain of species
Loss of species : loss of features exclusively represented by these species = endemism
Loss of area : loss of SR with the loss of species that were exclusively found in this area = complementarity
Probabilities of loss
Expected PD : PD given a set of species’ extinction probabilities.
Species case of Weitzman’s general expected diversity formula.
Delta PD q : change in expected PD if probability extinction of species (e.g. in a given area) changes from
qto 1.
The value will be large to the extent that the species shares long ancestral branches with few other species.PD50 : change in expected PD with a current probability of extinction of 0.5 for all species.
The value will be large when the species has long ancestral branches with few other descendants.
Dissimilarities
- PD dissimilarities : differences of evolutionary features between samples or localities
(sum of branches in one site only, divided by sum of all branches).
Dissimilarities with abundance information
Chao’s framework
Effective rare PD : defines “Valley numbers” in which the flexible parameter provides increasing focus on low abundance.
Effective amount of rare feature diversity
Dissimilarities (beta) & partitioning
PhyloSor :
- derived from the taxonomic-based Sorensen dissimilarity index
UniFrac :
- derived from the taxonomic-based Jaccard dissimilarity index
- total branch length unique to each community relative to the total branch length linking all species in both communities
- measures the proportion of evolutionary history unique to each community
Glossary
Node-based tree : simplest type of phylogenetic tree which represents only the topology, with no information on the lengths of branches connecting the nodes.
Distance-based tree : with quantitative branch lengths.
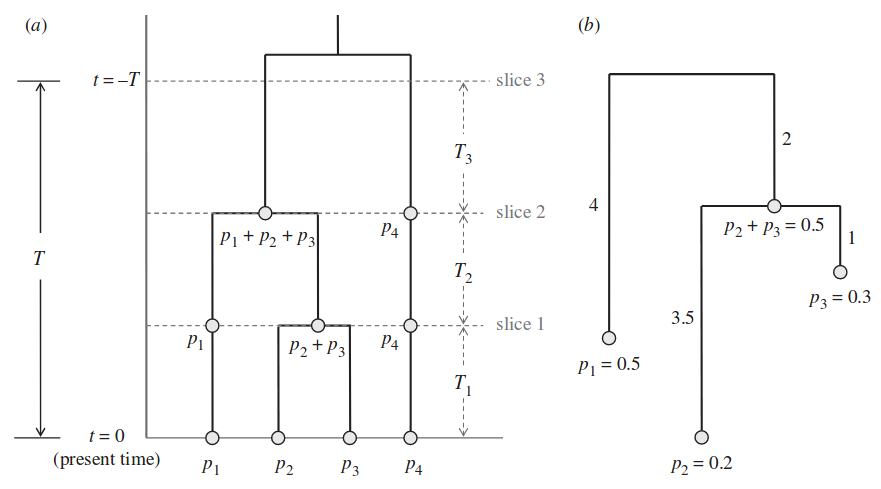
Ultrametric tree = in which the distances from the root to every branch tip are equal
= if the branch lengths are proportional to divergence time, all branch tips are the same distance from the tree base (first node) = a) on the graph, b) is non-ultrametric
Balanced tree : all tips are separated from the root by the same number of nodes, which is equivalent to saying that all lineages bifurcate the same number of times.
Imbalanced tree : one lineage descending from each node connects directly to a tip with no further bifurcations.
Polytomie : node where the lineage splits into three or more (most commonly due to data limitations).
Evenness : an even distribution of branches within the community has branches with about equal abundance; uneven distributions may be dominated by one or a few abundant branches.
Citations
Faith D. P. (2013). Biodiversity and evolutionary history: useful extensions of the PD phylogenetic diversity assessment framework. Ann N Y Acad Sci. Jun; 1289:69-89. https://doi.org/10.1111/nyas.12186
Vellend, M., Cornwell, W., Magnuson-Ford, K. & Mooers, A. (2010). Measuring phylogenetic biodiversity.
- Altschul, S. & Lipman, D. (1990). Equal animals. Nature 348, 493–494. https://doi.org/10.1038/348493c0
- May, R.M. (1990). Taxonomy as destiny. Nature, 347, 129-130.
- Nixon, K. & Wheeler, Q. (1990). An Amplification of the Phylogenetic Species Concept. Cladistics. 6. 211-223. https://doi.org/10.1111/j.1096-0031.1990.tb00541.x
- Nixon, K. & Wheeler, Q. (1991). Extinction and the origin of species. Extinction and Phylogeny.
- Pavoine, S., Ollier, S. & Dufour, A.‐B. (2005). Is the originality of a species measurable?. Ecology Letters, 8: 579-586. https://doi.org/10.1111/j.1461-0248.2005.00752.x
- Redding, D.W. & Mooers, A.Ø. (2006). Incorporating Evolutionary Measures into Conservation Prioritization. Conservation Biology, 20: 1670-1678. https://doi.org/10.1111/j.1523-1739.2006.00555.x
- Vane-Wright, R.I., Humphries, C.J. & Williams, P.H. (1991). What to protect? - Systematics and the agony of choice. Biological Conservation, 55, 235-254. https://doi.org/10.1016/0006-3207(91)90030-D
- Barker, G. (2002). Phylogenetic diversity: a quantitative framework for measurement of priority and achievement in biodiversity conservation. Biological Journal of the Linnean Society. 76. 165-194. https://doi.org/10.1046/j.1095-8312.2002.00055.x
- Crozier, R. (1997). Preserving the Information Content of Species: Genetic Diversity, Phylogeny, and Conservation Worth. Annual Review of Ecology and Systematics, 28, 243-268. http://www.jstor.org/stable/2952493
- Faith, D. (1992). Conservation evaluation and phylogenetic diversity. Biological Conservation. 61. 1-10. https://doi.org/10.1016/0006-3207(92)91201-3
- Helmus, M., Bland, T., Williams, C. & Ives, A. (2007). Phylogenetic measures of biodiversity. Am Nat 169(3):E68-E83. The American naturalist. 169. https://doi.org/10.1086/511334
- Rao, C. R. (1982). Diversity and Dissimilarity Coefficients: A Unified Approach. Theoretical population biology, 21, 24-43. Theoretical Population Biology. 21. 24-43. https://doi.org/10.1016/0040-5809(82)90004-1
- Warwick, R. & Clarke, K. (1995). New ‘biodiversity’ measures reveal a decrease in taxonomic distinctness with increasing stress. Marine Ecology Progress Series. 129. 301-305. https://doi.org/10.3354/meps129301
- Webb, C. (2000). Exploring the Phylogenetic Structure of Ecological Communities: An Example for Rain Forest Trees. The American naturalist. 156. 145-155. https://doi.org/10.1086/303378